
2025/3/25大约 7 分钟
线段与AABB求交的算法
如何快速判断任意线段与任意AABB是否相交?首先想到的方法是借助射线与AABB求交的算法,获得射线进入和离开的时机,在射线与AABB相交的前提下保证进入时机在线段终点之前。
下面是搜集到的三种算法即实现,并且通过添加轴的的维度完全可以应用于三维情况。
零、 数据结构
import random
import time
import numpy as np
import matplotlib.pyplot as plt


class Vec2D:
    def __init__(self, x, y):
        self.v = np.array([x, y])

    def __sub__(self, other):
        return Vec2D(self.v[0] - other.v[0], self.v[1] - other.v[1])

    def __getitem__(self, index):
        return self.v[index]

    def __mul__(self, scalar):
        return Vec2D(self.v[0] * scalar, self.v[1] * scalar)

    def __add__(self, other):
        return Vec2D(self.v[0] + other.v[0], self.v[1] + other.v[1])

    def ToString(self):
        return f'({self.v[0]},{self.v[1]})'

class Rect:
    def __init__(self, min_x, min_y, max_x, max_y):
        self.min = Vec2D(min_x, min_y)
        self.max = Vec2D(max_x, max_y)

    def ToString(self):
        return f'{{ {self.min.ToString()},{self.max.ToString()} }}'
一、 射线与AABB求交算法
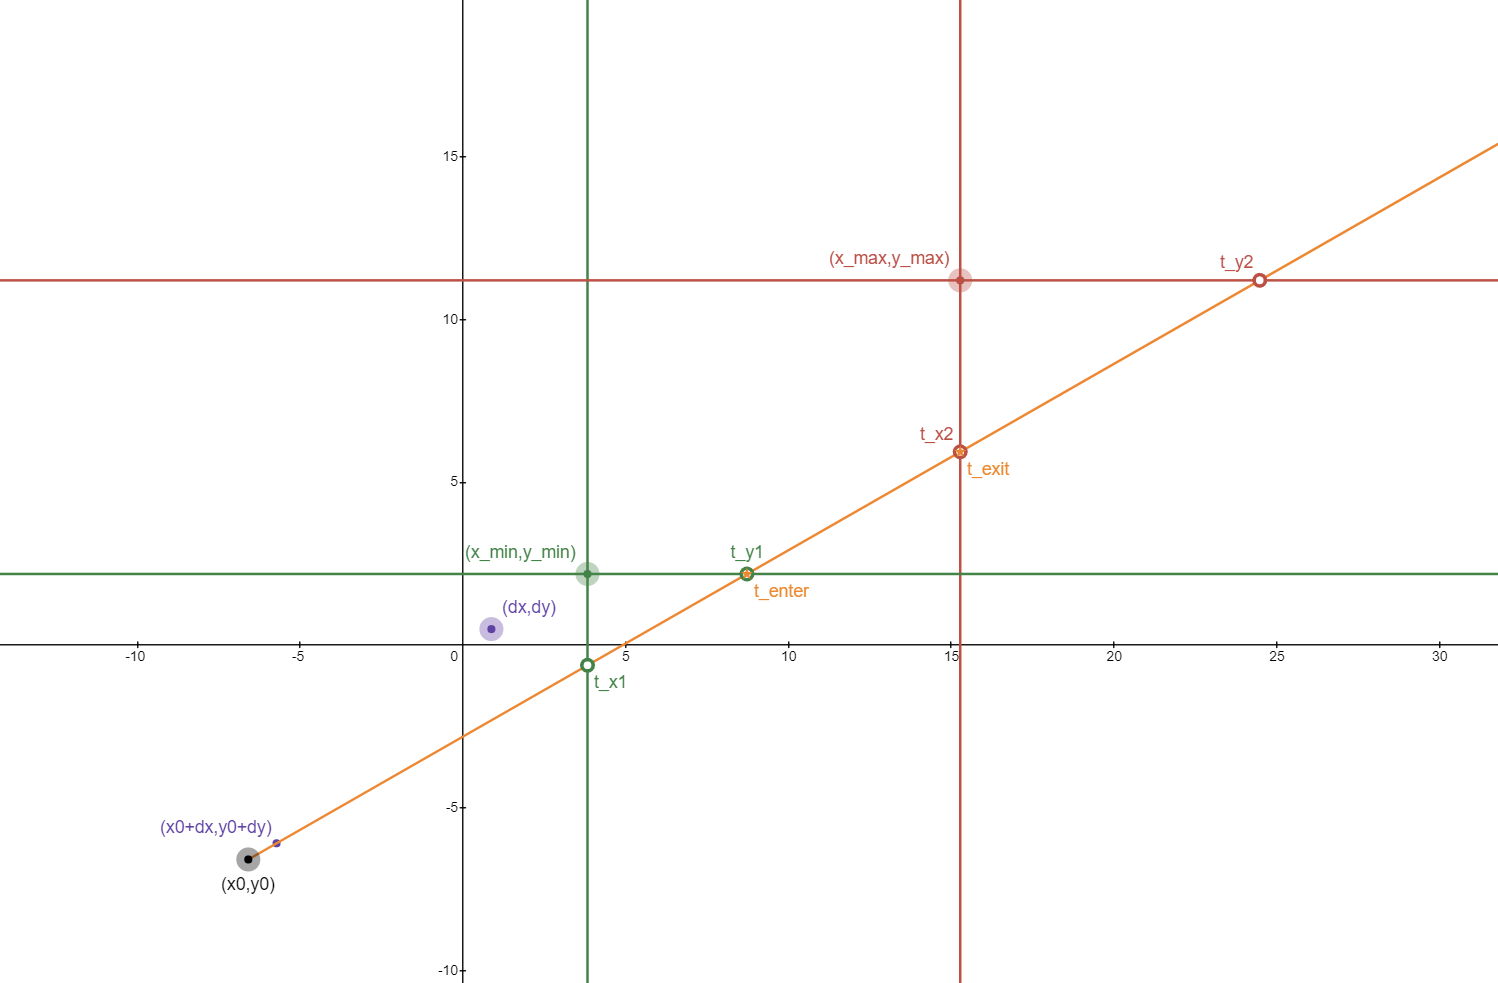
假设:
- 射线起点为,方向向量为,射线方程为
- AABB包围盒表示为
算法:
- 计算射线进入各个轴的时间,取最大值作为进入AABB的时间
- 计算射线离开各个轴的时间,取最小值作为离开AABB的时间
- 判断 是否成立(先进入、后离开),成立则相交,不成立则不相交
- 如需计算交点,计算 和 即为所求
实现:
# p1决定射线起点,p1、p2共同决定射线方向
def ray_aabb(p1, p2, aabb):
    d = np.linalg.norm(p2 - p1)
    t_min = 0
    t_max = float('inf')

    for axis in range(2):
        inv_d = 1.0 / d[axis] if d[axis] != 0 else float('inf')
        t0 = (aabb.min[axis] - p1[axis]) * inv_d
        t1 = (aabb.max[axis] - p1[axis]) * inv_d

        if inv_d < 0:
            t0, t1 = t1, t0

        t_min = max(t_min, t0)
        t_max = min(t_max, t1)

        if t_min > t_max:
            return False

    return True
Tricks:
- 根据方向向量 在指定轴上投影 的正负决定进入和离开该轴的时间
- 某个轴上出现 的情况,必不相交
二、 线段与AABB求交算法
1. 射线法
假设:
- 线段起点为,终点为,方向 ,线段方程为
- AABB包围盒表示为
算法:
参考射线与AABB求交的算法,只是方向非单位向量,参数t的上限约束到1
- 计算线段进入各个轴的时间,取最大值作为进入AABB的时间
- 计算线段离开各个轴的时间,取最小值作为离开AABB的时间
- 判断 是否成立(先进入、后离开),成立则相交,不成立则不相交
- 如需计算交点,计算 和 即为所求
# p1决定线段起点,p2决定线段终点
def seg_aabb(p1, p2, aabb):
    d = p2 - p1
    t_min = 0
    t_max = 1

    for axis in range(2):
        inv_d = 1.0 / d[axis] if d[axis] != 0 else float('inf')
        t0 = (aabb.min[axis] - p1[axis]) * inv_d
        t1 = (aabb.max[axis] - p1[axis]) * inv_d

        if inv_d < 0:
            t0, t1 = t1, t0

        t_min = max(t_min, t0)
        t_max = min(t_max, t1)

        if t_min > t_max:
            return False

    return True
Tricks:
- 将线段视为有上限的射线
2. liang_barsky算法
假设:
- 线段起点为,终点为,方向 ,线段方程为
- AABB包围盒表示为
算法:
- 联立方程
- 获得满足位于AABB内的点
- 计算逐个轴中 的上下限,以x轴为例:
- 预计算不等式中的各项,以x轴为例:
- 根据预计算结果,逐轴计算实际 的上下限并判断该轴内是否可能相交,以x轴为例:
即:
- 如需计算交点,计算 和 即为所求
实现:
def liang_barsky(p1, p2, aabb):
    dx = p2[0] - p1[0]
    dy = p2[1] - p1[1]

    p = [-dx, dx, -dy, dy]
    q = [p1[0] - aabb.min[0], aabb.max[0] - p1[0], p1[1] - aabb.min[1], aabb.max[1] - p1[1]]

    t0, t1 = 0.0, 1.0

    for i in range(4):
        if p[i] == 0:  # 线段平行于矩形的某一边
            if q[i] < 0:  # 线段在边界之外
                return False
        else:
            t = q[i] / p[i]
            if p[i] < 0:
                if t > t1:
                    return False  # 线段完全在边界外
                if t > t0:
                    t0 = t  # 向内裁剪
            else:
                if t < t0:
                    return False  # 线段完全在边界外
                if t < t1:
                    t1 = t  # 向内裁剪

    return True  # 线段与矩形相交
Tricks:
- 中间结果预计算
- 根据被除项的正负决定是上限还是下限
3. Cohen-Sutherland算法
原理: 将整个空间用AABB四条边划分为9个区域,并对区域进行编码,根据线段两端点所在区域编码快速决定线段与AABB的关系。无法立即判断的情况下对线段进行裁剪,递归判断
实现:
- 对空间进行编码,左中右分别使用10、00、01,上中下分别使用10、00、01,并加以组合获取9个编码
| 左 | 中 | 右 | |
|---|---|---|---|
| 上 | 10 10 | 10 00 | 10 01 |
| 中 | 00 10 | 00 00 | 00 01 |
| 下 | 01 10 | 01 00 | 01 01 |
获得线段两端点 , 所在区域的编码 ,
快速判断相交情况:
$ c_0 | c_1 = 0 $ , 必相交(线段全在AABB内)
$ c_0 & c_1 \neq 0 $ , 必不相交(线段两端点均在AABB某一侧)
- 其余情况需按照左右上下的顺序,求出虚交点 迭代判断
实现:
def compute_outcode(point, aabb):
    # 计算点的区域编码
    code = 0
    for axis in range(2):
        code = code << 2
        if point[axis] < aabb.min[axis]:
            code |= 0b01
        elif point[axis] > aabb.max[axis]:
            code |= 0b10
        else:
            code |= 0b00
    return code


def cohen_sutherland_clip(p0, p1, aabb):
    outcode0 = compute_outcode(p0, aabb)
    outcode1 = compute_outcode(p1, aabb)
    accept = False

    while True:
        # 如果两个端点都在裁剪窗口内,则接受该线段
        if not (outcode0 | outcode1):
            accept = True
            break
        # 如果两个端点的区域编码按位与不为零,则线段完全在裁剪窗口外
        elif outcode0 & outcode1:
            break
        else:
            # 选择在裁剪窗口外的点
            outcode_out = outcode0 if outcode0 else outcode1

            # 计算交点
            # 需要确定是哪个边界
            for axis in range(2):
                # 线段与轴的下限相交
                if outcode_out & (0b01 << 2 * (2 - 1 - axis)):
                    t = (aabb.min[axis] - p0[axis]) / (p1[axis] - p0[axis])
                    p = p0 + (p1 - p0) * t
                    break
                # 线段与轴的上限相交
                elif outcode_out & (0b10 << 2 * (2 - 1 - axis)):
                    t = (aabb.max[axis] - p0[axis]) / (p1[axis] - p0[axis])
                    p = p0 + (p1 - p0) * t
                    break

            # 更新点和区域编码
            if outcode_out == outcode0:
                p0 = p
                outcode0 = compute_outcode(p0, aabb)
            else:
                p1 = p
                outcode1 = compute_outcode(p1, aabb)

    if accept:
        return True  # (p0, p1)
    else:
        return False  # None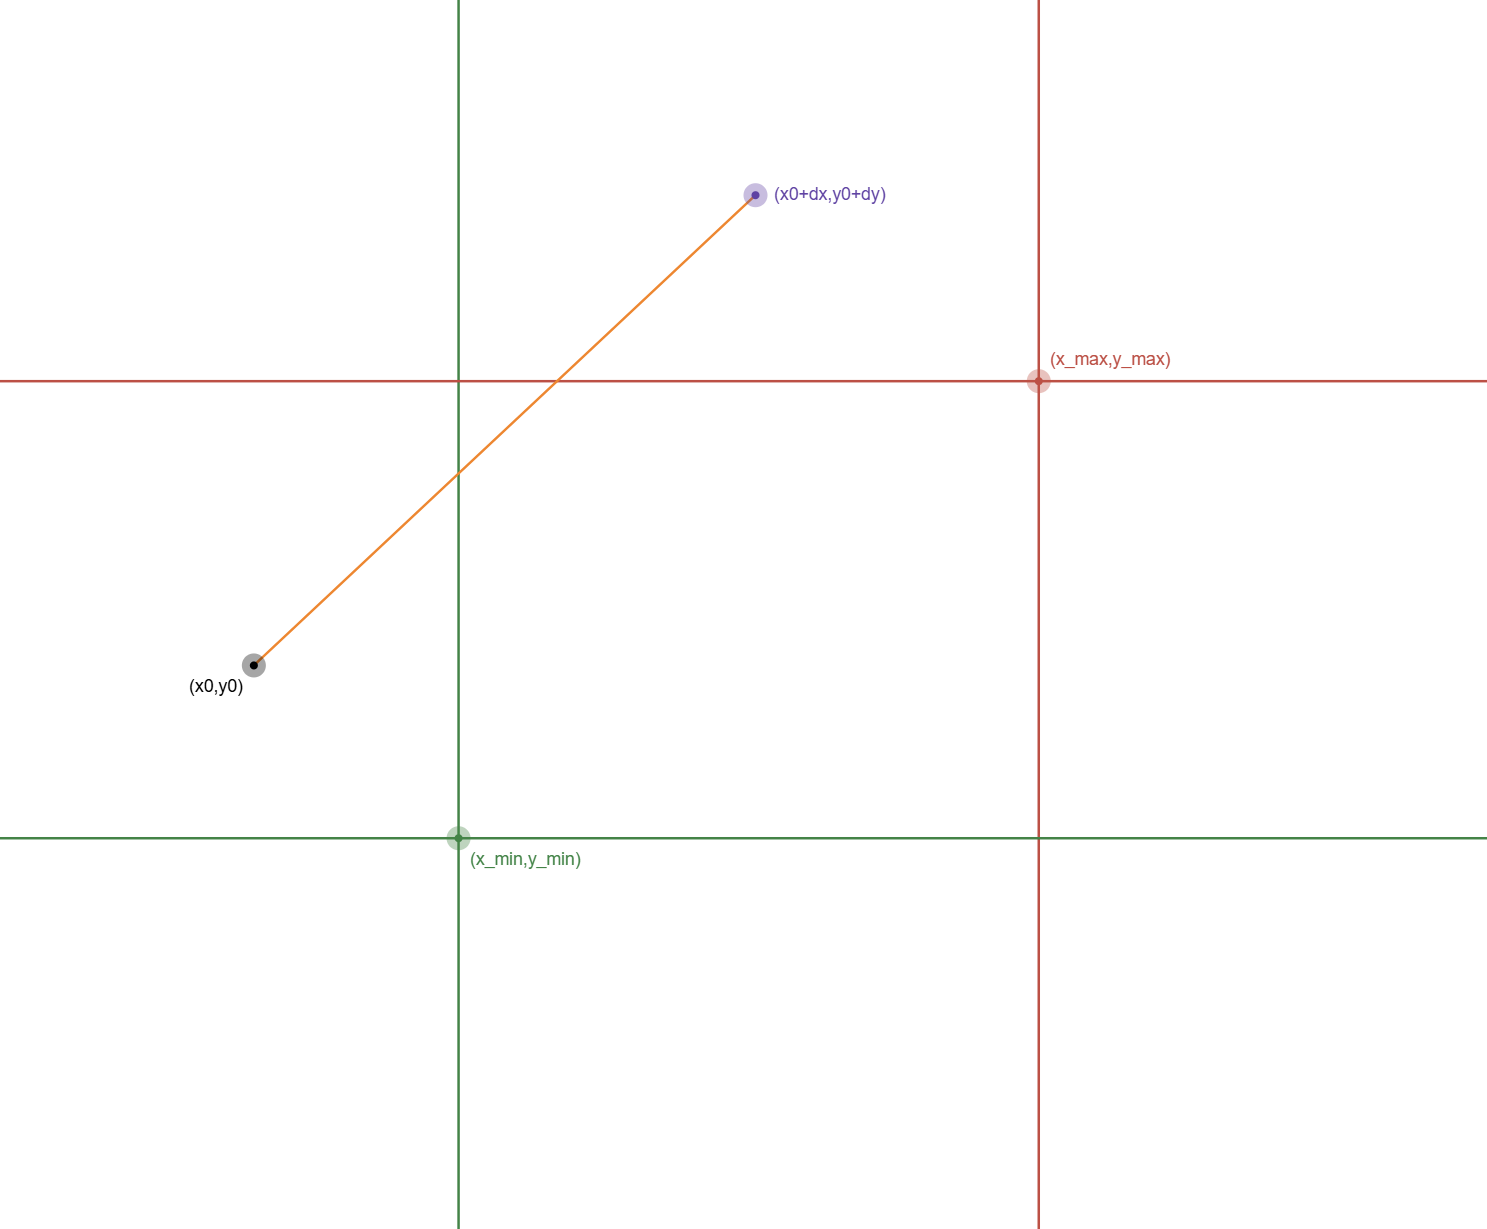
三、 测试代码
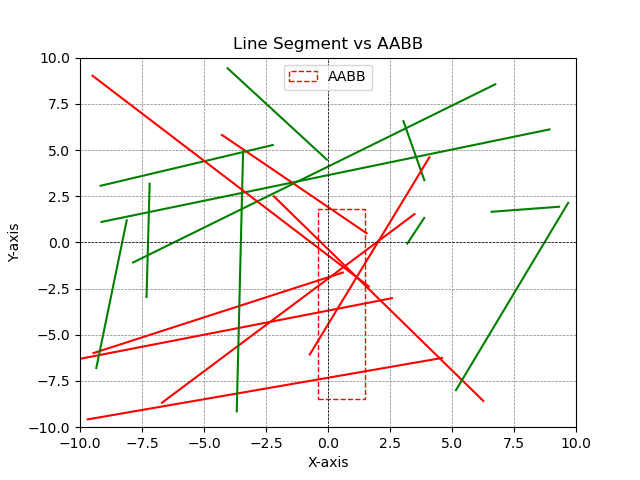
def visualize():
    center = np.array([random.uniform(-10, 10), random.uniform(-10, 10)])
    extend = np.array([random.uniform(0.1, 6.5), random.uniform(0.1, 6.5)])
    aabb = Rect(center[0] - extend[0], center[1] - extend[1], center[0] + extend[0], center[1] + extend[1])
    # aabb = Rect(2,1,3,4)
    # 绘制 AABB
    rectangle = plt.Rectangle((aabb.min[0], aabb.min[1]),
                              aabb.max[0] - aabb.min[0],
                              aabb.max[1] - aabb.min[1],
                              linewidth=1, edgecolor='r', facecolor='none', linestyle='--', label='AABB')

    plt.gca().add_patch(rectangle)

    for t in range(1, 20):

        p1 = Vec2D(random.uniform(-10, 10), random.uniform(-10, 10))
        p2 = Vec2D(random.uniform(-10, 10), random.uniform(-10, 10))

        # p1 = Vec2D(-1.40,-1.79)
        # p2 = Vec2D(4.54,1.39)

        # 检查并显示检测结果
        # is_collision = seg_aabb(p1, p2, aabb)
        # is_collision = liang_barsky(p1, p2, aabb)
        is_collision = cohen_sutherland_clip(p1, p2, aabb)
        print(f'{p1.ToString()}->{p2.ToString()},{aabb.ToString()},{is_collision}')
        if is_collision:
            line_color = 'r'
        else:
            line_color = 'g'
        # 绘制线段
        plt.plot([p1[0], p2[0]], [p1[1], p2[1]], color=line_color)

    # 设置坐标轴范围
    plt.xlim(-10, 10)
    plt.ylim(-10, 10)
    plt.axhline(0, color='black', linewidth=0.5, ls='--')
    plt.axvline(0, color='black', linewidth=0.5, ls='--')
    plt.grid(color='gray', linestyle='--', linewidth=0.5)
    plt.title('Line Segment vs AABB')
    plt.xlabel('X-axis')
    plt.ylabel('Y-axis')

    plt.legend()
    plt.show()

def test(t):
    start = time.perf_counter()
    for i in range(t):
        p1 = Vec2D(random.uniform(-10, 10), random.uniform(-10, 10))
        p2 = Vec2D(random.uniform(-10, 10), random.uniform(-10, 10))
        center = np.array([random.uniform(-10, 10), random.uniform(-10, 10)])
        extend = np.array([random.uniform(0.1, 6.5), random.uniform(0.1, 6.5)])
        aabb = Rect(center[0] - extend[0], center[1] - extend[1], center[0] + extend[0], center[1] + extend[1])
        is_collision = liang_barsky(p1, p2, aabb)
    end = time.perf_counter()
    runTime = end - start
    print("运行时间:", runTime, "秒")

visualize()
#test(1000000)